Technoarcheology and Earth Sciences, the Recovery of Nimbus II High Resolution Infrared Radiometer Data

Nimbus II + Typhoon Tracks Overlaid on Google Earth KML Format
Dennis Wingo and Keith Cowing: In 2008 the Lunar Orbiter Image Recovery Project (LOIRP) began a NASA ESMD sponsored project to resurrect 43+ year old Ampex FR-900 instrumentation tape drives for the purpose of recovering, before the capability to do so becomes impossible, the last surviving master tapes from the five Lunar Orbiter spaceraft that orbited the Moon in support of Apollo in 1966-67. Our project is proceeding on our task to do so.
During our research on the Ampex tape drives we scoured the NASA Technical Reports Server (http://ntrs.nasa.gov) as well as any other source we could get our hands on. During this search, we found, through a Cadillac (yes the car) user group, a gentleman from Alaska who had worked on these drives during the 1960’s. We were able to connect and while he had retired and the units were long gone to that great scrap yard in the sky, he told me something interesting. He said that during his time working on the drives that they had sent “miles and miles, thousands of tapes” to NASA during the Nimbus weather satellite program. This is where our new tale begins.
The Search for the Tapes and a New Direction
The LOIRP team knew from our documentation that all of our master tapes had once been in the possession of the federal records center in Suitland, MD. Also, a result of our investigation about the Nimbus II tapes (contemporaneous with Lunar Orbiter), we gained a small grant from CIRES, a cooperative institute of the National Oceanic and Atmospheric Administration (NOAA) to apply some of our LOIRP techniques for image correction to some third generation data that was recovered by John Moses, (EOSDIS Science Operations) at GSFC in 2007. Dr. Walt Meir is the NSIDC Principal Investigator (PI) on the project. The third generation Nimbus II tapes were tapes that had been processed and calibrated on old IBM 360 class mainframes. One of our tasks was also to attempt to find the original 2″ master tapes.
In 2009 Keith Cowing and I went to the federal records center in SUitland, Maryland, along with Dick Nafzger from NASA GSFC to determine whether or not there were any 2″ FR-900 tapes that could have possibly recorded the slow scan video from the Apollo 11 mission. In addition we were looking for any 2″ tapes from Nimbus that could be played that would be of higher fidelity than the third generation tapes.
Lamentably, it seems that the Nimbus II and III tapes that were 2″ were more than likely recycled at the same time as the Apollo 11 slow scan tapes. One thing that we have found in the documentation is that there were multiple copies of second generation tapes made and sent around the nation to various researchers. There is a possibility that some of these tapes still exist and if any reader of this knows of them, please contact us through NASA Watch.
Nimbus in Historical Context
In the 1960’s coincident with the Apollo program, NASA began a series of experimental weather and climate monitoring spacecraft. Both visible light and infrared instruments were placed on the spacecraft, which was launched into an 1100 km near circular polar orbit. Nimbus I was launched on August 28, 1964. A failure of the Agena upper stage left the spacecraft in an elliptical orbit that was still usable for science. The spacecraft failed on September 22nd 1964 when the solar panels became locked. It is interesting in this era of long lived NASA spacecraft that none of the early Nimbus spacecraft operated for very long. Below is an artist rendering of the spacecraft in orbit.

Figure 1: Nimbus Spacecraft
The High Resolution Imaging Radiometer (HRIR) instrument had a resolution of approximately 8.5 kilometers on the ground, which was high resolution in that time period. The HRIR detector operated in the 3.5-4.1 micron infrared band, where the influence of CO2 and water vapor absorption was minimized. Since the sensor was fixed and used a scanning mirror to provide image swaths (a line perpendicular to the spacecraft motion), the resolution of the system decreased to about 35 km x 20 km at the edges of the scan. The HRIR as well as the Medium Resolution Imaging Radiometer (MRIR), and the visible light Automatic Picture Transmission (APT) Camera were all mounted on the nadir face (bottom) of the spacecraft. It was a very early three axis stabilized system with a +/- 1 degree resolution pointing accuracy.
Although the Nimbus I spacecraft only operated for a few weeks, the HRIR instrument was operational during the Arctic sea ice minimum, and the Antarctic sea ice maximum in 1964. This is probably the only record of the total extent of the ice pack in that year at these critical dates and the NSIDC is very interested in obtaining this data. Sometimes we feel like Zahi Hawass, the famous head of the Egyptian Antiquities Authority, climbing around in the catacombs of data.
Moving forward in time, Nimbus II was launched on May 15, 1966 and the HRIR instrument operating through November 15th 1966 when the data tape recorder failed. Some real time data was downloaded till January 17, 1969 when the Horizon sensor failed which disabled the pointing system. Over 2400 HRIR records were transmitted from the spacecraft and samples of these are the ones that we have been working on. The Nimbus III spacecraft was launched on April 14th 1969 and transmitted data from its HRIR instrument until January 25th 1970. The spacecraft failed in September of that year due to the failure of its horizon scanner.
LOIRP Team Work on Nimbus II HRIR Images
After determining that it was highly unlikely that any of the early Nimbus 2″ analog tapes still existed we began our work to rectify some of the image artifacts in the Nimbus II HRIR data files. The data that we were working with is remarkably similar to the Lunar Orbiter raw analog data, but this is two generations removed from the raw data, the sync pulses and the calibration data had been removed. This was probably in order to save tape back in the 1960’s. The surviving original data today is of fairly poor quality. Figure 2 shows an HRIR image scanned from the film record (again, similar to Lunar Orbiter):

Figure 2: Nimbus II HRIR Images
Both of these images are of hurricane Inez, a hurricane that had at one point a sustained wind speed of over 150 mile per hour (strong CAT-4). This hurricane killed over 1000 people in its path over the Caribbean to Mexico, making it one of the most deadly storms on record. At this time it was extremely difficult to get real time data from the spacecraft to watch the development and path of the storm, which with today’s weather satellites we take for granted.
Looking at figure 2 above each line of temperature samples are really just voltages that represent temperatures of the emission of radiation from the Earth at night in the infrared (all HRIR swaths are in the nighttime). In the Nimbus nomenclature each line is a swath and it represents a scan of the Earth perpendicular to the direction of travel of the satellite. Not shown are a group of sync pulses on either end of the line. This is where our work with the LOIRP Lunar Orbiter images became important. Just as we have to line up each line of visible light image for our images of the Moon, the same is true of the Nimbus images. Figure 3 shows the nature of our problem with the Nimbus data:

Figure 3: Close up of Lake Michigan and Signal Jitter in Nimbus II Recovered Images
The “jitter” artifacts that have distorted the shape of Lake Michigan (leftmost image) are the result of a shift in the lines of temperature data in the swaths. Since all we have to work with are the third generation data that does not have the original sync pulses, there is no way to use the same methods that we have used to do line by line corrections to the Lunar Orbiter data.
Our programmer Matt Sandler has come up with a way to correct the jitter artifact that is traceable for future researchers to maintain the scientific integrity of the data. These methods are detailed in a poster that was presented at the American Geophysical Union 2009 conference in San Francisco CA in December of last year poster 1N41A-1108). Figure 4 shows the efficacy of the fix on a contrast enhanced black and white detailed image of the Lake Michigan area:

Figure 4: Image Corrections as Applied to A Detail of Lake Michigan
All of this is well and good and is proper for a scientific paper, but it is of little use unless the overall dataset is available for researchers in a modern format that is easily accessible and able to be manipulated to find the edges of the ice pack or to follow hurricanes back in that time period. Nimbus II and Google Earth
Beginning over the Christmas holidays Matt Sandler and I began an effort to translate the Nimbus II HRIR data to a Google Earth friendly format. The HRIR records have extensive embedded metadata within them that was both a help and a hindrance to our efforts. Each individual swath has 31 anchor points, which are longitude/latitude pairs that describe a function of where to place the digitized temperature data on the Earth. This was done in computer processing back in the 1960’s in order to help researchers to correctly map the data to various Earth projections. When we attempted to use these anchor points, our resulting mapping of the image to Google Earth was a complete failure. After many attempts to use the anchor points in some manner that would work, we abandoned the effort and tried a different approach.
Each swath had three things that allowed us to map the images to Google Earth. The first and most important is the sub-satellite point, which is the intersection of the spacecraft’s nadir face to the Earth. We also had the beginning and ending latitude and longitude from the anchor points and the altitude of the spacecraft for each data record which was provided every six swaths. Matt took this information, along with another critical piece of information, which was the field of view of the sensor, and used this to ray trace the corners of each individual temperature record to the spherical shape of the Earth from the altitude of the spacecraft. Matt did this using techniques derived from the video game software design world. We also assigned colors to the temperature records corresponding to the temperature scaling from the metadata. The result was stunning. Figure 5 is a full day of Nimbus II image swaths mapped to Google Earth:

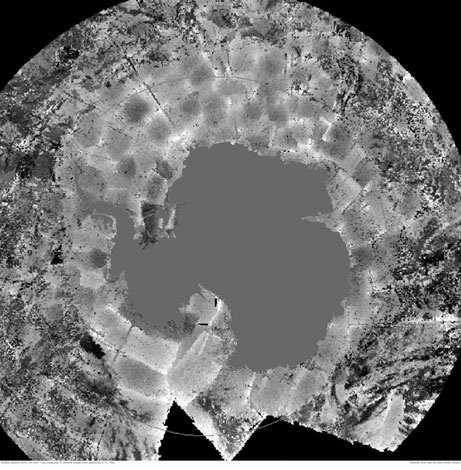
Figure 5: Google Earth Mosaic of Nimbus II Temperature Data September 23, 1966
In looking at this data we have been able to identify the Ross Ice Shelf near the peak of the Antarctic Ice maximum of 1966 as well as a tentative identification of the ice pack for the Arctic ice minimum. We have also improved the accuracy of the geo-referencing of the data from ~40km down to ~10km. This will aid in more accurately determining the extent of sea ice. Further processing that would lead to a definitive determination of the area of the Arctic and Antarctic sea ice would be invaluable to climate change researchers as reliable data in this regard today only stretches back into the late 1970’s. One of the things that the LOIRP team is going to do is to take the Nimbus II HRIR data from August 23rd 1966 and overlay that with the Lunar Orbiter 1 data on the same date for a composite mosaic. There is potential for a significant synergy between Lunar Orbiter, Apollo, and Nimbus II and III data sets. This type of synergy could provide many benefits to the Earth sciences community.
The mapping of the Nimbus II data by Matt was aided by the use of the NASA Ames developed Whirlwind package, which could be described as a scientific version of Google Earth. We have been playing around with other data sets to merge them with our Nimbus data and found on a Japanese climate website the Google Earth mapping of typhoons from 1966 on our Nimbus II HRIR data. The match was perfect and is shown in figure 6:
Figure 6: Nimbus II + Typhoon Tracks Overlaid on Google Earth KML Format
The Scientific and Social Value of Merged Data Sets
Common format programs such as Google Earth (no they are not paying me to say this) provide an impressive platform for the merging of disparate yet related data sets by unconnected researchers worldwide. This also allows an interested public a window into scientific data and its uses. The educational value of this in teaching Earth Sciences, weather forecasting, and associated disciplines is enormous as well. We will be releasing the files for this on Moonviews.com as well as through the NSIDC.
Our team is working with our sponsors to take what we have developed as a proof of principle and extend it to all of the Nimbus II data that is currently available. Dr. John Moses from NASA GSFC is working to get the rest of the Nimbus data sets from Nimbus I and III translated from the original data tapes to a digital format that will allow this process that we have been developed to work on the rest of the HRIR data sets (the instrument flew on these early missions). This would allow Dr. Meir and his team at the NSIDC to find the total area of the Arctic sea ice minimum from Nimbus I in 1964, 1966, and 1969. We are looking to take the Nimbus data and develop mosaics that can be animated to where you could follow the tracks of hurricanes as well as the ebb and flow of the ice packs. This data exists from the later Nimbus, Landsat, and other missions as well and is a fertile field for us to develop to provide this data to the climate change, hurricane, and other Earth Sciences fields.
It seems to us that our efforts in technoarcheology for the Lunar Orbiter images is yielding a lot of fruit that we never thought about when we started our efforts. NASA spends billions of dollars in developing new missions but little funding has been available to mine these old data sets. It is our hope that by providing this data in a user friendly format such as Google Earth at a very modest cost, we can help the scientific community to benefit from this data and provide the means for the public to be involved as well. The files that we have developed and have used in the preparation of this paper will be placed on line for the public’s viewing pleasure.
Our special thanks go out to Dr. John Moses from NASA GSFC who had the vision to go back to the dark archives at the National Records Center to get the Nimbus tapes and get them digitized. We also want to recognize our science PI at the NSIDC, Dr. Walt Meir who came to us to see what the possibility was to save, correct, and use the Nimbus II HRIR data sets. Dave Gallaher was our project manager and helped us in many ways, watching the development of detective work and was our guardian angel in helping to check our work. The University of Colorado Boulder handled our grant and paid on time! We look forward to seeing what the past brings to light next! And of course, thanks to Keith Cowing who has seen this project and its offspring through with his time and generous financial support.