
 NASA Asks International Astronomical Union to Name Lunar Crater After Mike Wargo
“NASA is asking the International Astronomical Union to name a crater on the moon in his honor “so his name will be forever enshrined in the heavens.”
– NASA Lunar Exploration Analysis Group Statement on the Passing of Dr. Michael Wargo, earlier post
– Mike Wargo, earlier post
China Releases High Resolution Moon Maps Made From Chang’e-2 Data

China on Monday published a set of full coverage of moon map and moon images with a resolution of seven meters captured by the country’s second moon orbiter, the Chang’e-2. (Xinhua Photo)
BEIJING, Feb. 6 (Xinhua) — China on Monday published a full coverage map of the moon, as well as several high-resolution images of the celestial body, captured by the country’s second moon orbiter, the Chang’e-2.
The map and images, released by the State Administration of Science, Technology and Industry for National Defence (SASTIND), are the highest-resolution photos of the entirety of the moon’s surface to be published thus far, said Liu Dongkui, deputy chief commander of China’s lunar probe project.
The images were photographed by a charge-coupled device (CCD) stereo camera on the Chang’e-2 from heights of 100 km and 15 km over the lunar surface between October 2010 and May 2011, according to a statement from SASTIND.
The resolution of the images obtained from Chang’e-2 is 17 times greater than those taken by the its predecessor, the Chang’e-1.
Continue reading “China Releases High Resolution Moon Maps Made From Chang’e-2 Data”
Powerful Pixels: Mapping the Apollo Zone on the Moon
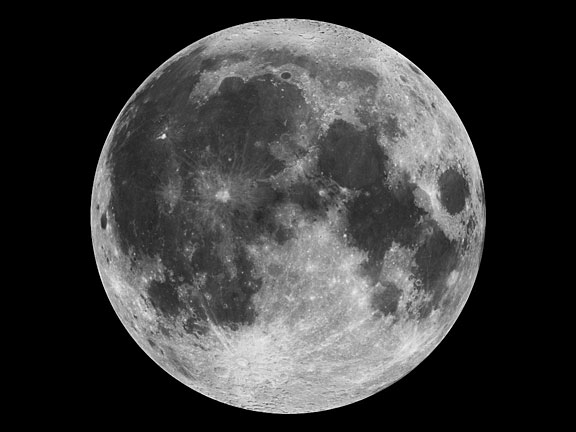
Mosaic of the near side of the moon as taken by the Clementine star trackers. The images were taken on March 15, 1994. Credit: NASA
Grayscale pixels – up close, they look like black, white or grey squares. But when you zoom out to see the bigger picture, they can create a digital photograph, like this one of our moon: For NASA researchers, pixels are much more – they are precious data that help us understand where we came from, where we’ve been, and where we’re going.
At NASA’s Ames Research Center, Moffett Field, Calif., computer scientists have made a giant leap forward to pull as much information from imperfect static images as possible. With their advancement in image processing algorithms, the legacy data from the Apollo Metric Camera onboard Apollo 15, 16 and 17 can be transformed into an informative and immersive 3D mosaic map of a large and scientifically interesting part of the moon.
The “Apollo Zone” Digital Image Mosaic (DIM) and Digital Terrain Model (DTM) maps cover about 18 percent of the lunar surface at a resolution of 98 feet (30 meters) per pixel. The maps are the result of three years of work by the Intelligent Robotics Group (IRG) at NASA Ames, and are available to view through the NASA Lunar Mapping and Modeling Portal (LMMP) and Google Moon feature in Google Earth.
“The main challenge of the Apollo Zone project was that we had very old data – scans, not captured in digital format,” said Ara Nefian, a senior scientist with the IRG and Carnegie Mellon University-Silicon Valley. “They were taken with the technology we had over 40 years ago with imprecise camera positions, orientations and exposure time by today’s standards.”
The researchers overcame the challenge by developing new computer vision algorithms to automatically generate the 2D and 3D maps. Algorithms are sets of computer code that create a procedure for how to handle certain set processes. For example, part of the 2D imaging algorithms align many images taken from various positions with various exposure times into one seamless image mosaic. In the mosaic, areas in shadows, which show up as patches of dark or black pixels are automatically replaced by lighter gray pixels. These show more well-lit detail from other images of the same area to create a more detailed map.

Left: A normal one-camera image of the lunar surface. Right: A composite Apollo Zone image showing the best details from multiple photographs. Credit: NASA/Google Earth
“The key innovation that we made was to create a fully automatic image mosaicking and terrain modeling software system for orbital imagery,” said Terry Fong, director of IRG. “We have since released this software in several open-source libraries including Ames Stereo Pipeline, Neo-Geography Toolkit and NASA Vision Workbench.”
Lunar imagery of varying coverage and resolution has been released for general use for some time. In 2009, the IRG helped Google develop “Moon in Google Earth”, an interactive, 3D atlas of the moon. With “Moon in Google Earth”, users can explore a virtual moonscape, including imagery captured by the Apollo, Clementine and Lunar Orbiter missions.
The Apollo Zone project uses imagery recently scanned at NASA’s Johnson Space Center in Houston, Texas, by a team from Arizona State University. The source images themselves are large – 20,000 pixels by 20,000 pixels, and the IRG aligned and processed more than 4,000 of them. To process the maps, they used Ames’ Pleiades supercomputer.
The initial goal of the project was to build large-scale image mosaics and terrain maps to support future lunar exploration. However, the project’s progress will have long-lasting technological impacts on many targets of future exploration.
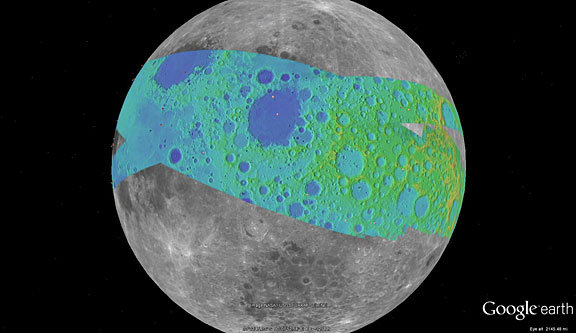
The color on this map represents the terrain elevation in the Apollo Zone mapped area. Credit: NASA/Google Earth
“The algorithms are very complex, so they don’t yet necessarily apply to things like real time robotics, but they are extremely precise and accurate,” said Nefian. “It’s a robust technological solution to deal with insufficient data, and qualities like this make it superb for future exploration, such as a reconnaissance or mapping mission to a Near Earth Object.”
Near Earth Objects, or “NEOs” are comets and asteroids that have been attracted by the gravity of nearby planets into orbits in Earth’s neighborhood. NEOs are often small and irregular, which makes their paths hard to predict. With these algorithms, even imperfect imagery of a NEO could be transformed into detailed 3D maps to help researchers better understand the shape of it, and how it might travel while in our neighborhood.
In the future, the team plans to expand the use of their algorithms to include imagery taken at angles, rather than just straight down at the surface. A technique called photoclinometry – or “shape from shading” – allows 3D terrain to be reconstructed from a single 2D image by comparing how surfaces sloping toward the sun appear brighter than areas that slope away from it. Also, the team will study imagery not just as pictures, but as physical models that give information about all the factors affect how the final image is depicted.
“As NASA continues to build technologies that will enable future robotic and human exploration, our researchers are looking for new and clever ways to get more out of the data we capture,” said Victoria Friedensen, Joint Robotic Precursor Activities manager of the Human Exploration Operations Mission Directorate at NASA Headquarters. “This technology is going to have great benefit for us as we take the next steps.”
This work was funded by NASA’s LMMP, and supported by collaborators at NASA’s Marshall Space Flight Center, Huntsville, Alabama, NASA’s Goddard Space Flight Center, Greenbelt, Maryland, NASA’s Jet Propulsion Laboratory, Pasadena, Calif. and the United States Geological Survey (USGS).
To view the maps, visit the LMMP site or view in Google Earth:
1. Download Google Earth at: http://earth.google.com
2. Click here to download a KML file for viewing in Google Earth: http://byss.ndc.nasa.gov/stereopipeline/dataviz/apollo_metric.kml
3. Once you open that file in Google Earth you will have options to view these “Apollo Zone” maps overlaid on Google Earth’s “Moon mode”.
Jessica Culler, 650-604-4789
Ames Research Center, Moffett Field, Calif.
Apollo Zone Digital Image Mosaic and Digital Elevation Model Released
 The “Apollo Zone” Digital Image Mosaic (DIM) and Digital Elevation Model (DEM) have just been released. These maps cover approx. 18% of the Lunar surface at a resolution of 1024 pixels per degree (approx 30 m/pixel). The maps are the result of 3 years worth of work by the ARC Intelligent Robotics Group (IRG) to align and process more than 4,000 images from the Apollo Metric (Mapping) Camera, which flew aboard Apollo 15, 16, and 17.
To preview the “Apollo Zone” maps, download the following KML file for viewing in Google Earth :
Once you open that file in Google Earth you will have options to view these “Apollo Zone” maps overlaid on Google Earth’s “Moon mode”. The maps have also been uploaded to the Lunar Mapping and Modeling Project (LMMP) portal (http://lmmp.nasa.gov) and will soon be available for visualization and download via that site.
The “Apollo Zone” maps cover the following sites of interest: Apollo 15, Apollo 16, Alphonsus Crater, Rima Prinz, Aristarchus Plateau-2, Ina D Caldera, Sulpicius Gallus, Mare Crisium, Mare Smythii, King Crater, Tsiolkovskiy Crater, Aitken Crater, and half of Van de Graaf Crater.
The terrain model has an average vertical accuracy of 40 m/pixel and standard deviation of 37 m (compared to LOLA laser altimetry tracks). Over 46% of the covered surface has vertical errors lower than 25 m.
The “Apollo Zone” maps (image, elevation, hillside, colorshade, confidence and precision) were automatically generated using new computer vision algorithms developed by IRG:
– robust statistical sub-pixel stereo correspondence
– robust bundle adjustment and radiometric corrections for large-scale image mosaics
– orbital camera position/orientation estimation using interest point extraction
– photometric correction of exposure time, shadow removal and generation of seamless large-scale image mosaics.
– photometric method for reconstructing lunar albedo
– photoclinometric terrain reconstruction method that improves lunar DTM precision
– statistical method for multiple stereo digital terrain model mosaicking
– multi-view 3D terrain reconstruction
– DTM/LOLA alignment and lidar / image matching
These algorithms have been released as NASA open-source (Ames Stereo Pipeline, Neo-Geography Toolkit, and NASA Vision Workbench). Map processing was performed using the NASA Pleiades supercomputer. In addition to the Apollo Metric Camera images, the fully automatic map processing pipeline has also been used with data from the Lunar Reconnaissance Orbiter Camera (LROC) and by several planetary science groups.
This work was funded by the Lunar Mapping and Modeling Project (LMMP). We gratefully acknowledge the support of our collaborators at NASA MSFC, NASA GSFC, JPL and USGS. Special thanks go to Ray French and Mark Nall for their support and leadership of LMMP.
Posted by: Soderman/NLSI Staff
LRO Imagery Helps Locate Titanium on the Moon
 Subtly Shaded Map of the Moon Reveals Titanium Treasure Troves
“A map of the Moon combining observations in visible and ultraviolet wavelengths shows a treasure trove of areas rich in titanium ores. Not only is titanium a valuable element, it is key to helping scientists unravel the mysteries of the Moon’s interior. Mark Robinson and Brett Denevi will be presenting the results from the Lunar Reconnaissance Orbiter mission today at the joint meeting of the European Planetary Science Congress and the American Astronomical Society’s Division for Planetary Sciences.”
Moon’s Rough ‘Wrinkles’ Reveal Clues to Its Past
 Written on the Moon’s weary face are the damages it has endured for the past 4.5 billion years. From impact craters to the dark plains of maria left behind by volcanic eruptions, the scars are all that remain to tell the tale of what happened to the Moon. But they only hint at the processes that once acted — and act today — to shape the surface. To get more insight into those processes, Meg Rosenburg and her colleagues at the California Institute of Technology, Pasadena, Calif. put together the first comprehensive set of maps revealing the slopes and roughness of the Moon’s surface. These maps are based on detailed data collected by the Lunar Orbiter Laser Altimeter (LOLA) on NASA’s Lunar Reconnaissance Orbiter. LOLA and LRO were built at NASA’s Goddard Space Flight Center in Greenbelt, Md. More
Lunar Mapping and Modeling Project
 NASA has created a new interactive web-based tool that incorporates observations from past and current lunar missions creating one of the most comprehensive lunar research websites to date.
The Lunar Mapping and Modeling Project at NASA’s Marshall Space Flight Center in Huntsville, Ala. has created an online set of capabilities and tools that will allow anyone with an Internet connection to search through, view, and analyze a vast number of lunar images and other digital products. The data and tools available through the project website will allow researchers to perform in-depth analyses to support mission planning and system design for lunar exploration and science missions. It will permit detailed scientific analysis and discovery and open additional educational and outreach opportunities.
Lunar Reconnaissance Orbiter Delivers Treasure Trove Of Data
 NASA’s Lunar Reconnaissance Orbiter (LRO) team released Tuesday the final set of data from the mission’s exploration phase along with the first measurements from its new life as a science satellite. With this fifth release of data, striking new images and maps have been added to the already comprehensive collection of raw lunar data and high-level products, including mosaic images, that LRO has made possible. The spacecraft’s seven instruments delivered more than 192 terabytes of data with an unprecedented level of detail. It would take approximately 41,000 typical DVDs to hold the new LRO data set.
Continue reading “Lunar Reconnaissance Orbiter Delivers Treasure Trove Of Data”
LRO Camera Mosaic: The Far Side of the Moon
 Caption: The lunar farside as never seen before! LROC WAC orthographic projection centered at 180 degrees longitude, 0 degrees latitude. Credit: NASA/Goddard/Arizona State University.
Because the moon is tidally locked (meaning the same side always faces Earth), it was not until 1959 that the farside was first imaged by the Soviet Luna 3 spacecraft (hence the Russian names for prominent farside features, such as Mare Moscoviense). And what a surprise – unlike the widespread maria on the nearside, basaltic volcanism was restricted to a relatively few, smaller regions on the farside, and the battered highlands crust dominated. A different world from what we saw from Earth.
Continue reading “LRO Camera Mosaic: The Far Side of the Moon”
Student Project: New Lunar Crater Search Using LROC-NAC Vs LOIRP Lunar Orbiter Images

Figure 1: Lunar Orbiter II sub-frame 2070H2 superimposed on LROC NAC image M116154252LE.
N. G. Moss1 and T. M. Harper2, M. B. Motta3, A. Epps4
1LOIRP Project P.O. Box 375 Moffett Field, CA 94035, Neulynm-at-yahoo.com, 2 LOIRP Project P.O. Box 375 Moffett Field, CA 94035, travis.martin.harper-at-gmail.com. 3 LOIRP Project P.O. Box 375 Moffett Field, CA 94035. Mbmotta-at-yahoo.com., 4Skycorp, Building 596, NASA Ames Research Park, Moffett Field, CA 94035, Austin.epps-at-gmail.com
Submitted to 42nd Lunar and Planetary Science Conference.
Introduction: In 1966 and 1967 NASA sent five Lunar Orbiters to photograph nearly the full surface of the moon. Each orbiter launched took images of different areas of the moons surface, or very high resolution images corresponding to lower resolution images previously taken. Lunar Orbiter Image Recovery Project (LOIRP) is one of the several projects using these images for research. We are in possession of 1,478 2″ original analog tapes from 3 Deep Space Network ground stations. We have taken hundreds of those analog tapes and converted them to digital form; with the majority of them being from Lunar Orbiter II which took images with .8 to 1 meter resolution.
Arizona State University Lunar Orbiter Maps the Moon With EMC Isilon
EMC Corporation (NYSE: EMC), the world leader in information infrastructure solutions, today announced that the Arizona State University School of Earth and Space Exploration (SESE) has deployed EMC Isilon(R) scale-out NAS to power the processing and analysis of tens of thousands of lunar images from NASA’s Lunar Reconnaissance Orbiter (LRO), with the aim of identifying ideal landing sites and areas of permanent shadow and illumination on the Moon’s surface. Using Isilon’s NL-Series, powered by the OneFS(R) operating system, SESE has consolidated its entire image processing, analysis and archiving workflow onto a single file system, simplifying big data management to reduce operating costs and increase research productivity. Additionally, using Isilon’s SyncIQ(R) asynchronous replication application, SESE can replicate its massive collection of lunar imagery to a second Isilon NL cluster to ensure maximum data reliability and availability.
Continue reading “Arizona State University Lunar Orbiter Maps the Moon With EMC Isilon”
Lunar Craters Provisionally Named for Columbia Astronauts

Names for seven craters in the Apollo basin on the Moon have been provisionally approved by the International Astronomical Union to honor the seven Space Shuttle Columbia astronauts. The names can be seen in the list of lunar crater names in the Gazetteer of Planetary Nomenclature.
The names are: Husband, McCool, Chawla, L. Clark, M. Anderson, D. Brown, Ramon.
Note that first initials have been used for Anderson, Brown, and Clark to distingiush them from other crater names on the Moon which honor persons with the same surnames. [Larger image] (source: USGS Astrogeology Center)