
Long-lost images taken from the first Nimbus satellite are revealing new information about what the world looked like from space before the beginning of the modern-day satellite record in 1979. While NASA never really lost the data (it was stored in federal archives) they did lose the ability to access it for nearly 40 years. Recovered images of Antarctica showed a greater extent of sea ice than ever measured before by scientists–but the record was short lived. In an odd twist of fate, the new record was broken in September 2014, only weeks after the discovery.
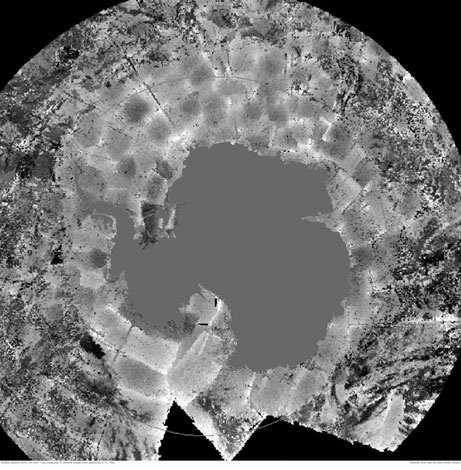
To create the map at right, David Gallaher and Garrett Campbell at the National Snow and Ice Data Center (NSIDC) at the University of Colorado tracked down hundreds of 35- and 70-millimeter black-and-white film reels and data tapes at NOAA’s National Climatic Data Center in Asheville, North Carolina. They digitized the film with an automatic film scanner and, with the help of University of Colorado students, documented the time and geographic location for each image, based on the orbit of the satellite. The images are actually mosaics stitched together from nearly 4,000 scanned frames.
While the quality and resolution of modern data are better than the historical data, the recovered satellite images provided enough detail for scientists to estimate sea ice extent in September, the typical month of the winter maximum in the Southern Hemisphere. The map shows the best 7-day composite of satellite images from September 6-13, 1964.
The yellow line shows sea ice extent in September 1964 when it maxed out at about 19.7 million square kilometers (12.2 million square miles)–the largest ever recorded until this year. Only two years later in 1966, the winter maximum sea ice extent had dropped nearly 20 percent to reach a record low. The red line shows maximum sea ice extent exactly fifty years later when the Antarctic set a new record high for daily extent of 20.11 million square kilometers (7.76 million square miles) on September 22.
Although the two records in 1964 and 1966 were just two years apart, explains an in-depth article in National Geographic, the difference in sea ice extent was more than 1.5 million square miles (4 million square kilometers), an area twice the size of Mexico. Many factors can lead to increases and decreases in Antarctic sea ice from year to year, including variations in large-scale atmospheric and oceanic circulation patterns and local sea surface temperatures.
But how is it that fifty years later, we are seeing ice sea extent levels equivalent to what we saw in the 1960s before global temperatures began accelerating? Well, this is actually not so surprising; while sea ice is rapidly thinning and retreating in the Arctic, similar signs of global-scale warming related to sea ice have been pretty much absent or inconclusive in Antarctica since the modern satellite age began. Increases and decreases in Antarctic sea ice from year to year are largely driven by variations in large-scale atmospheric and oceanic circulation patterns and local sea surface temperatures.
As we explained in a recent article, the Antarctic sea ice growth spurt in 2014 may be due to stronger winds and slightly fresher sea surface water around the margins of the continent’s melting ice shelves. Gallaher and Campbell hope that extending the data record back in time 15 years will give scientists even more historical context in their investigation of sea ice variability in the region.
So far, NSIDC has made more than 250,000 images public, and in addition to uncovering past sea ice records in Antarctica, has discovered more secrets from the 1960s including mysterious holes in Arctic sea ice and the first-ever high-resolution glimpse at the highly destructive Hurricane Camille. The scientists are now focused on securing funds to analyze more images and make more data available to the public.