
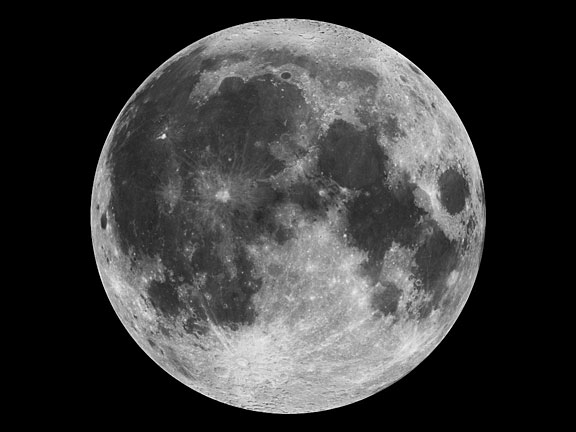
Mosaic of the near side of the moon as taken by the Clementine star trackers. The images were taken on March 15, 1994. Credit: NASA
Grayscale pixels – up close, they look like black, white or grey squares. But when you zoom out to see the bigger picture, they can create a digital photograph, like this one of our moon: For NASA researchers, pixels are much more – they are precious data that help us understand where we came from, where we’ve been, and where we’re going.
At NASA’s Ames Research Center, Moffett Field, Calif., computer scientists have made a giant leap forward to pull as much information from imperfect static images as possible. With their advancement in image processing algorithms, the legacy data from the Apollo Metric Camera onboard Apollo 15, 16 and 17 can be transformed into an informative and immersive 3D mosaic map of a large and scientifically interesting part of the moon.
The “Apollo Zone” Digital Image Mosaic (DIM) and Digital Terrain Model (DTM) maps cover about 18 percent of the lunar surface at a resolution of 98 feet (30 meters) per pixel. The maps are the result of three years of work by the Intelligent Robotics Group (IRG) at NASA Ames, and are available to view through the NASA Lunar Mapping and Modeling Portal (LMMP) and Google Moon feature in Google Earth.
“The main challenge of the Apollo Zone project was that we had very old data – scans, not captured in digital format,” said Ara Nefian, a senior scientist with the IRG and Carnegie Mellon University-Silicon Valley. “They were taken with the technology we had over 40 years ago with imprecise camera positions, orientations and exposure time by today’s standards.”
The researchers overcame the challenge by developing new computer vision algorithms to automatically generate the 2D and 3D maps. Algorithms are sets of computer code that create a procedure for how to handle certain set processes. For example, part of the 2D imaging algorithms align many images taken from various positions with various exposure times into one seamless image mosaic. In the mosaic, areas in shadows, which show up as patches of dark or black pixels are automatically replaced by lighter gray pixels. These show more well-lit detail from other images of the same area to create a more detailed map.

Left: A normal one-camera image of the lunar surface. Right: A composite Apollo Zone image showing the best details from multiple photographs. Credit: NASA/Google Earth
“The key innovation that we made was to create a fully automatic image mosaicking and terrain modeling software system for orbital imagery,” said Terry Fong, director of IRG. “We have since released this software in several open-source libraries including Ames Stereo Pipeline, Neo-Geography Toolkit and NASA Vision Workbench.”
Lunar imagery of varying coverage and resolution has been released for general use for some time. In 2009, the IRG helped Google develop “Moon in Google Earth”, an interactive, 3D atlas of the moon. With “Moon in Google Earth”, users can explore a virtual moonscape, including imagery captured by the Apollo, Clementine and Lunar Orbiter missions.
The Apollo Zone project uses imagery recently scanned at NASA’s Johnson Space Center in Houston, Texas, by a team from Arizona State University. The source images themselves are large – 20,000 pixels by 20,000 pixels, and the IRG aligned and processed more than 4,000 of them. To process the maps, they used Ames’ Pleiades supercomputer.
The initial goal of the project was to build large-scale image mosaics and terrain maps to support future lunar exploration. However, the project’s progress will have long-lasting technological impacts on many targets of future exploration.
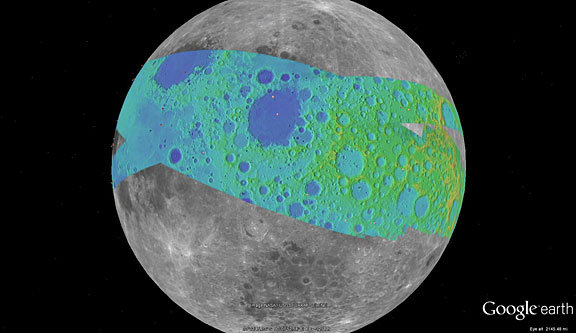
The color on this map represents the terrain elevation in the Apollo Zone mapped area. Credit: NASA/Google Earth
“The algorithms are very complex, so they don’t yet necessarily apply to things like real time robotics, but they are extremely precise and accurate,” said Nefian. “It’s a robust technological solution to deal with insufficient data, and qualities like this make it superb for future exploration, such as a reconnaissance or mapping mission to a Near Earth Object.”
Near Earth Objects, or “NEOs” are comets and asteroids that have been attracted by the gravity of nearby planets into orbits in Earth’s neighborhood. NEOs are often small and irregular, which makes their paths hard to predict. With these algorithms, even imperfect imagery of a NEO could be transformed into detailed 3D maps to help researchers better understand the shape of it, and how it might travel while in our neighborhood.
In the future, the team plans to expand the use of their algorithms to include imagery taken at angles, rather than just straight down at the surface. A technique called photoclinometry – or “shape from shading” – allows 3D terrain to be reconstructed from a single 2D image by comparing how surfaces sloping toward the sun appear brighter than areas that slope away from it. Also, the team will study imagery not just as pictures, but as physical models that give information about all the factors affect how the final image is depicted.
“As NASA continues to build technologies that will enable future robotic and human exploration, our researchers are looking for new and clever ways to get more out of the data we capture,” said Victoria Friedensen, Joint Robotic Precursor Activities manager of the Human Exploration Operations Mission Directorate at NASA Headquarters. “This technology is going to have great benefit for us as we take the next steps.”
This work was funded by NASA’s LMMP, and supported by collaborators at NASA’s Marshall Space Flight Center, Huntsville, Alabama, NASA’s Goddard Space Flight Center, Greenbelt, Maryland, NASA’s Jet Propulsion Laboratory, Pasadena, Calif. and the United States Geological Survey (USGS).
To view the maps, visit the LMMP site or view in Google Earth:
1. Download Google Earth at: http://earth.google.com
2. Click here to download a KML file for viewing in Google Earth: http://byss.ndc.nasa.gov/stereopipeline/dataviz/apollo_metric.kml
3. Once you open that file in Google Earth you will have options to view these “Apollo Zone” maps overlaid on Google Earth’s “Moon mode”.
Jessica Culler, 650-604-4789
Ames Research Center, Moffett Field, Calif.
 The Clementine Atlas of the Moon